A Dynamic Benchmark for Operational Energy Forecasting
Energy-Arena is an open, API-driven dynamic benchmarking platform for operational energy forecasting. Researchers and practitioners submit forecasts for energy time series such as electricity prices, load, and renewable generation under standardized challenge definitions and operational submission deadlines. Submissions are evaluated in a forward-looking process once ground truth becomes available, and performance is tracked through continuously updated leaderboards based on rolling evaluation windows, enabling transparent and comparable benchmarking as energy systems evolve.
Publication growth in energy forecasting
Forecasting electricity prices, load, and renewable generation has become essential for power system operators, energy traders, and analysts as renewable penetration and market volatility rise across Europe. This trend is reflected in the sharp growth of related research, as can be seen over the last 15 years.
Despite a vast body of literature and notable open-access efforts, the field still lacks a widely accepted, continuously updated dynamic benchmark that captures evolving system conditions. As a result, it remains difficult to assess state-of-the-art forecasting performance, which slows consistent and measurable progress in both research and commercial practice.
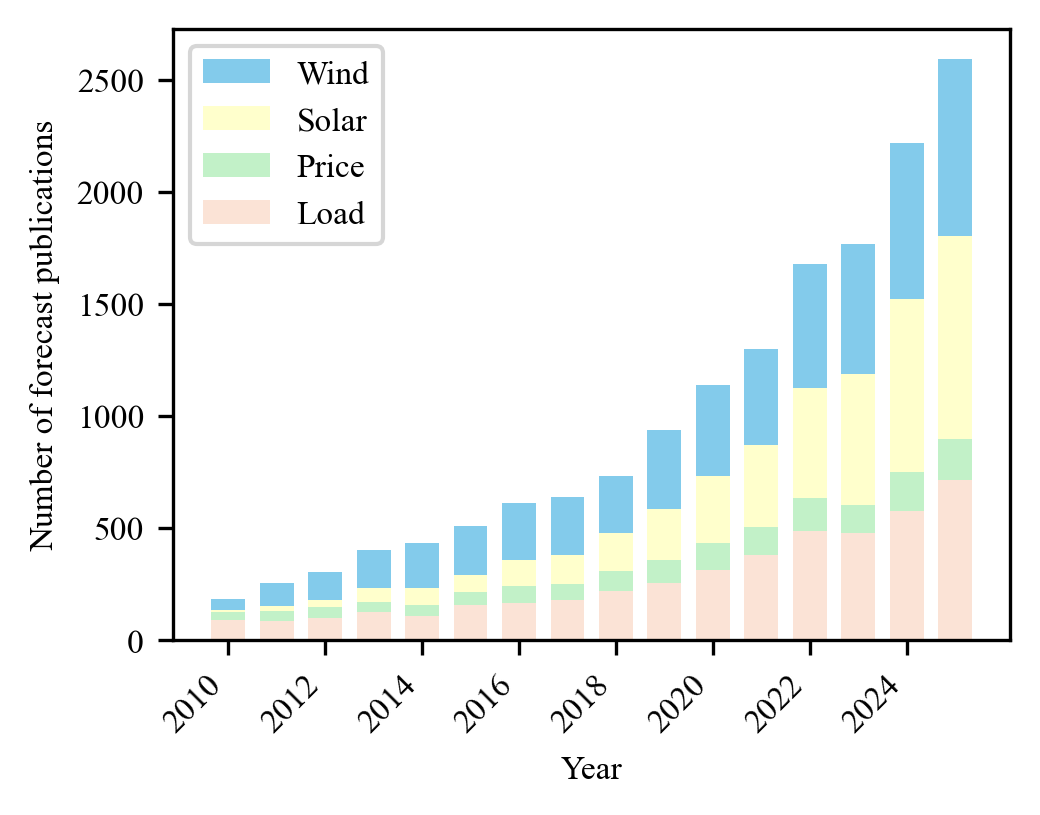
Source: Scopus Search API (query option 6), extracted on March 2, 2026. Data: CSV. Workflow: scopus-figure1-eem-paper-2026.
Platform architecture and participation workflow
Energy-Arena is a modular API-driven benchmark that links challenge configurations, forecast submission, automated scoring, and continuously updated leaderboards.
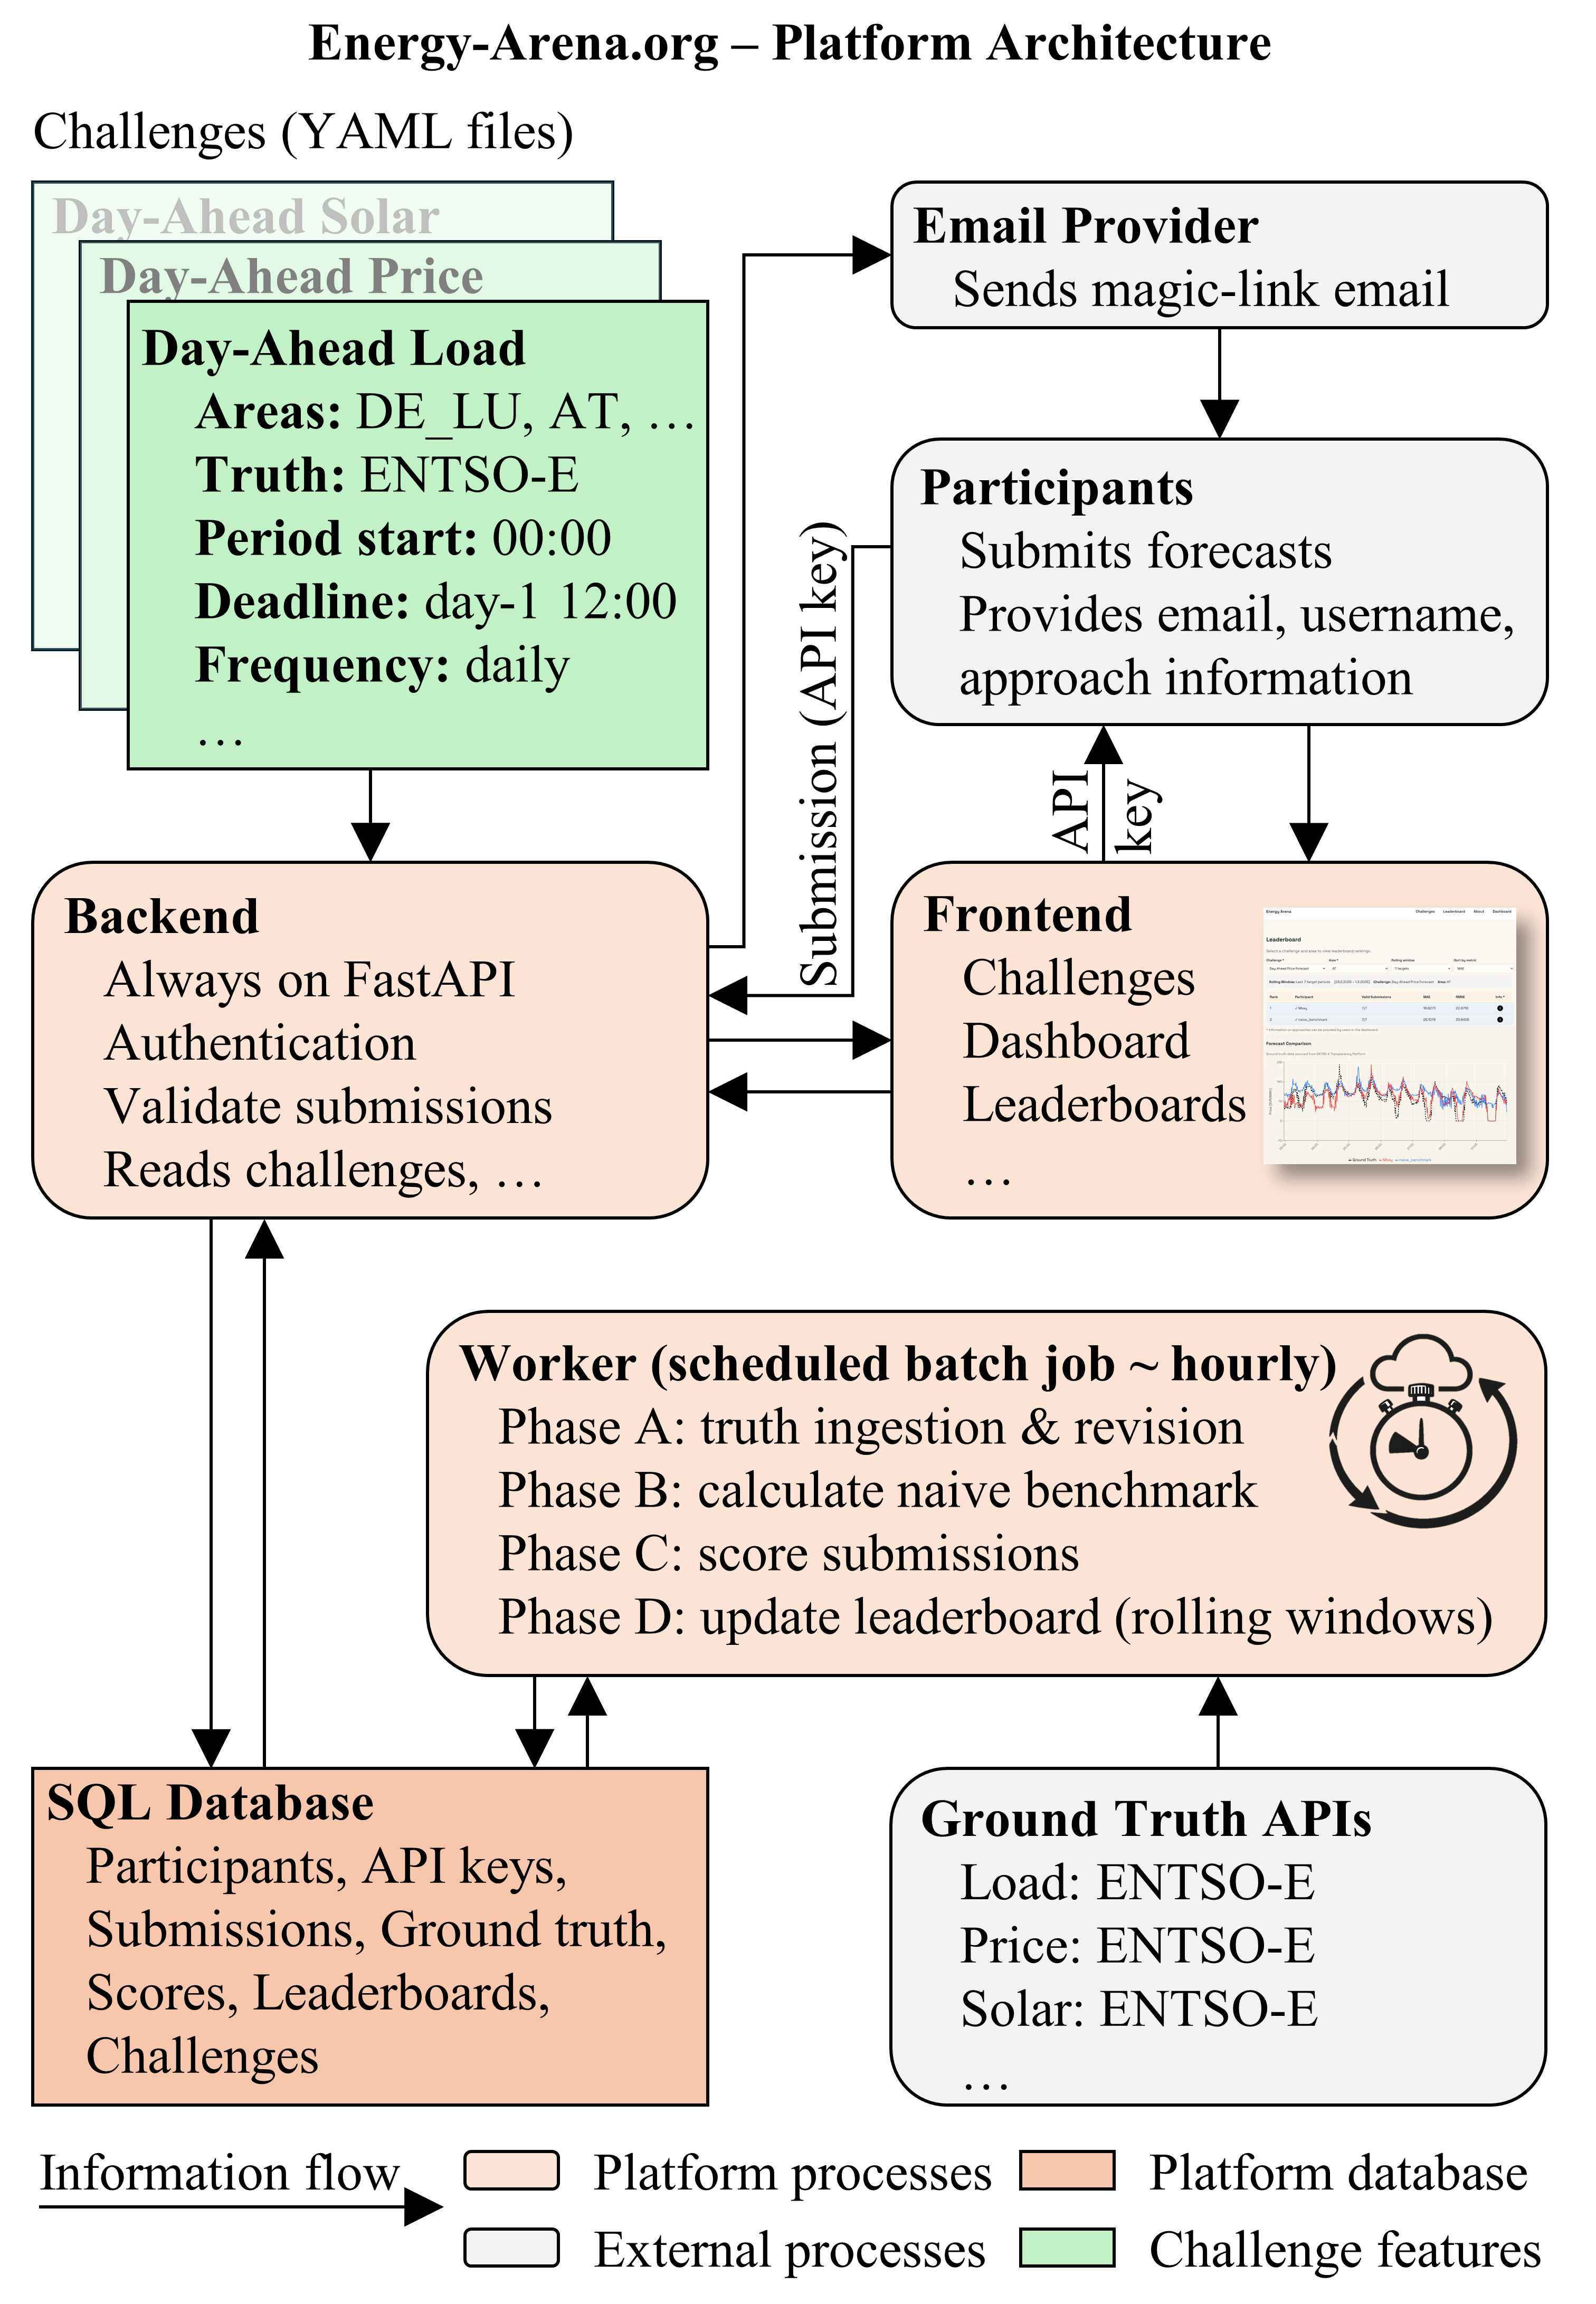
Platform Architecture
The platform combines standardized challenge definitions, participant interaction, automated scoring, and rolling leaderboards in one modular API-driven system.
Forecasts are submitted via API and validated against challenge rules and submission deadlines. Ground truth is ingested from providers such as ENTSO-E, then a worker pipeline evaluates pending submissions and updates leaderboard aggregates. Public browser-visible realized-value charts are currently sourced via SMARD.
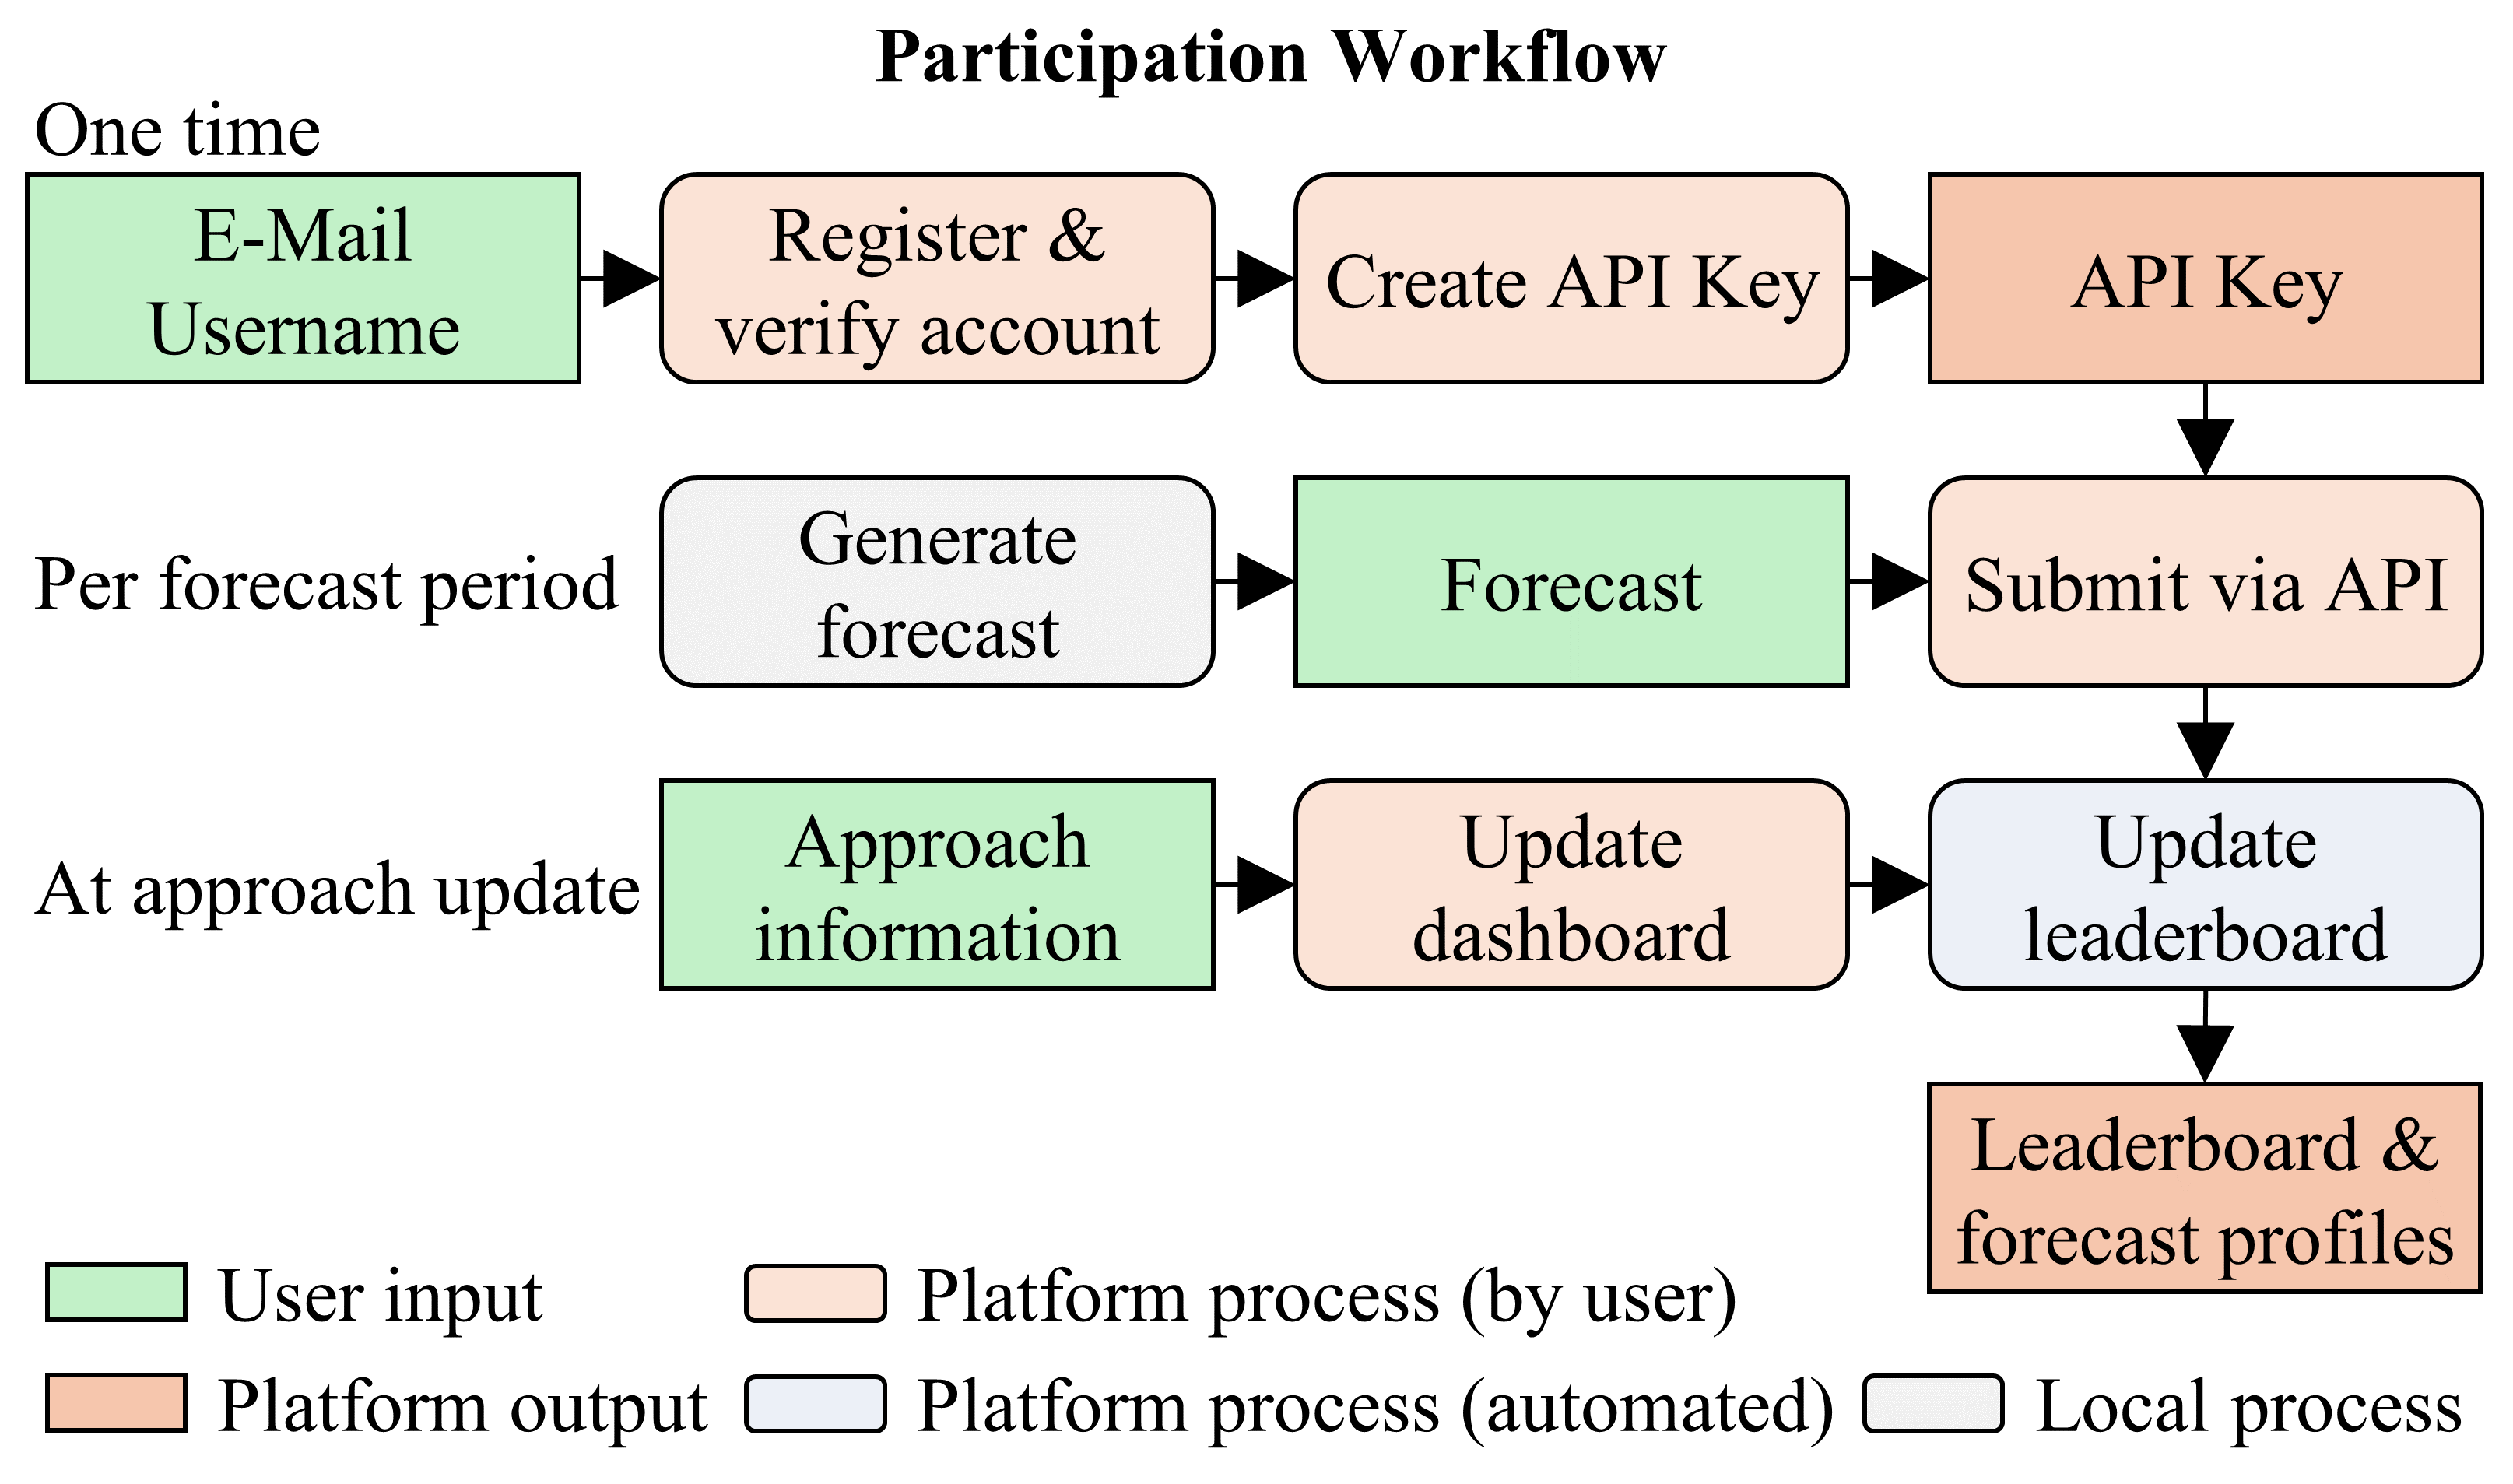
Participation Workflow
Participation starts with a one-time account setup and then recurring forecast submissions aligned with each challenge schedule.
In the dashboard, participants create API keys for automated submission and can optionally provide approach metadata and choose forecast visibility.